back

F1Stats
Real time Formula 1 data website
2025


Overview
I built a web-based Formula 1 statistics tracker that aggregates
live race data, driver standings, and team results from
1950 to 2025 into one unified platform. By sourcing data
from the Ergast API and presenting it with interactive
graphs, EJS templating, and responsive CSS, the app
delivers a streamlined, mobile-optimized experience for
exploring F1 history.
This was a passion project of mine that allowed me to combine my love for Formula 1 with my programming skills. It taught me about API handling and optimizing performance.
key contributions
designed user interface in Figma
developed front end using HTML, CSS, JavaScript, and EJS templates
utlized Node.js and Express to fetch and process live data from Ergast API
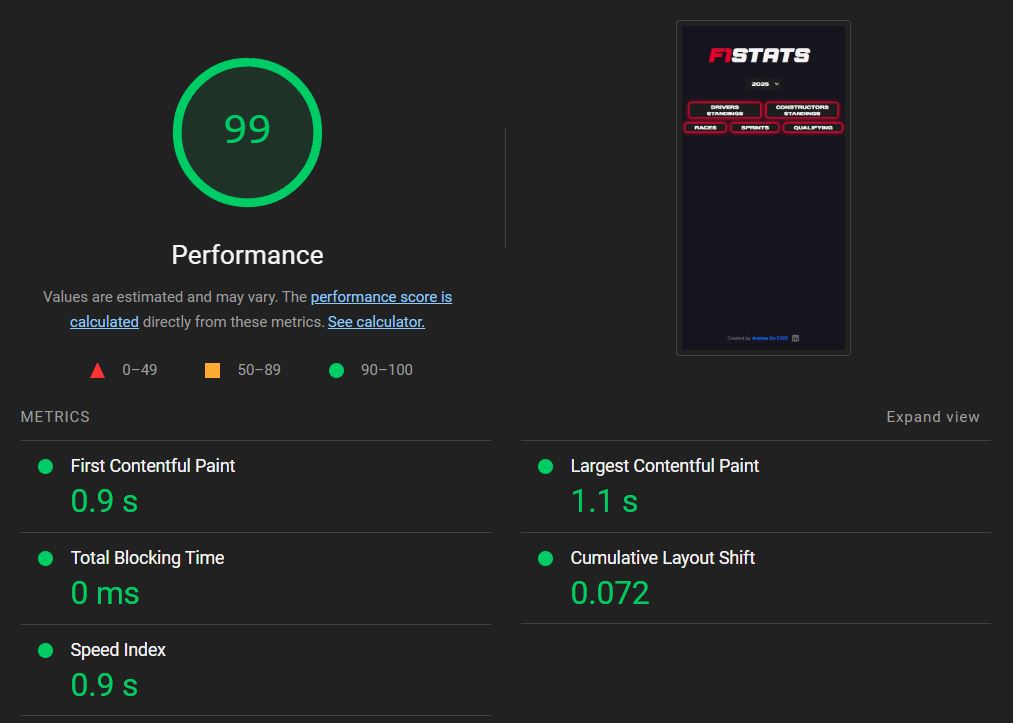
optimized load times (~0.9s FCP, ~0.9s Speed Index), benchmarked with Lighthouse
boosted backend throughput by ~2% via GZIP compression, JavaScript bundling, & deferred loading, verified by Autocannon
Design and Development
The design goal for F1Stats was to create a sleek, modern user interface that mirrors the high-tech, fast-paced aesthetic of Formula 1.

Choosing the right fonts
To ensure the design felt authentic, I selected fonts that are similar to the style used in official F1 branding.
Integrating Ergast API
Ergast API is a free, open-source service that offers comprehensive Formula 1 statistics spanning from 1950 to 2024. It provides in-depth data on driver standings, constructor performance, race results, and more.
Mobile optimization
Recognizing that many users would access the site on the go, I prioritized a responsive, mobile-first design approach from the start.
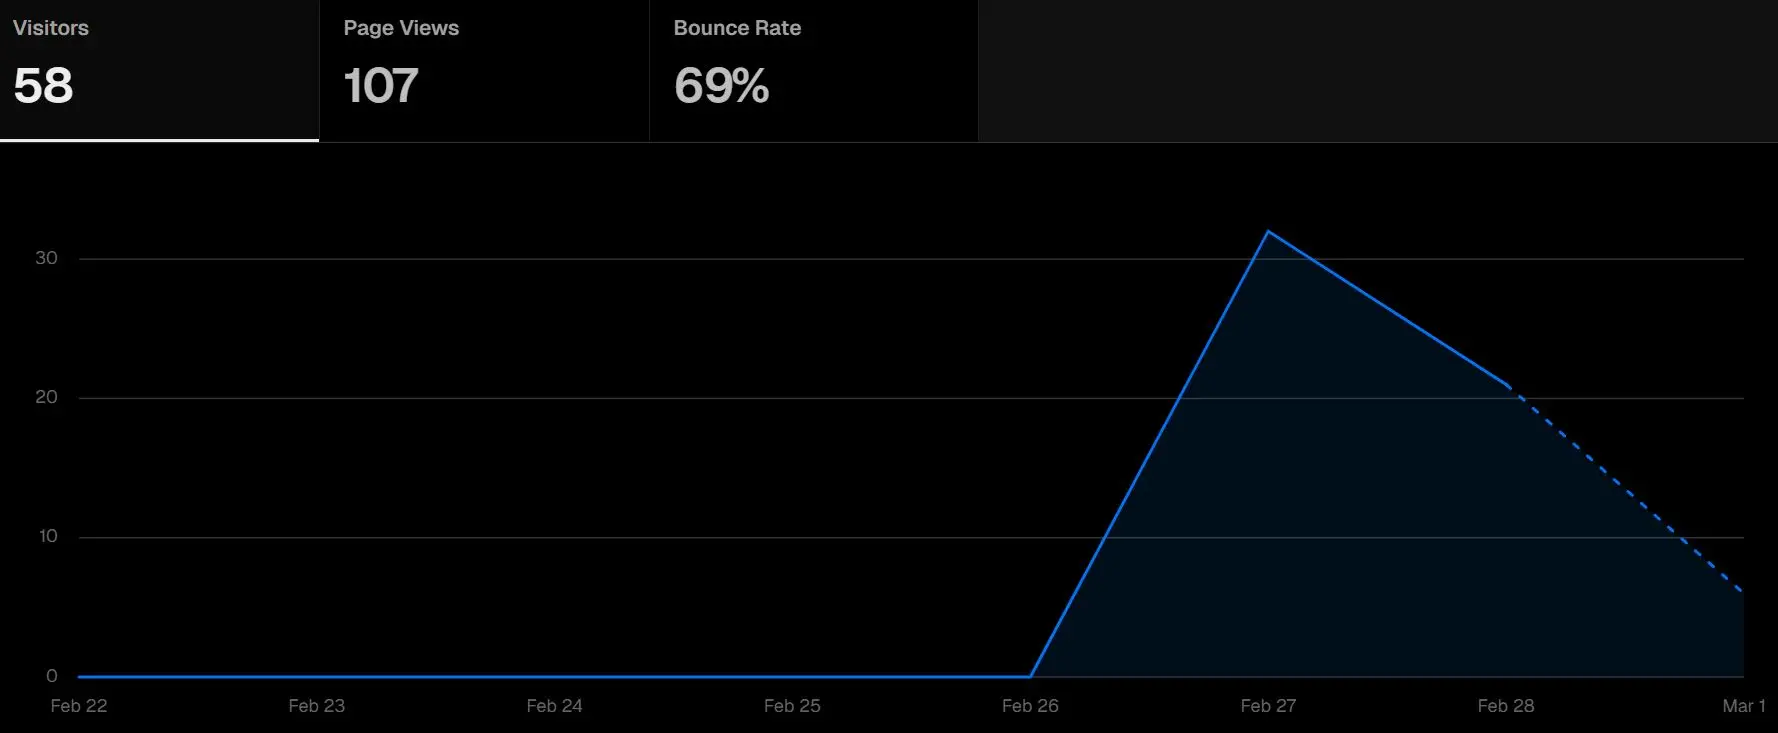
Vercel Analytics
After deploying F1Stats to Vercel, I shared my website on LinkedIn. Within 3 days, it amassed 58 visitors and 107 page views.
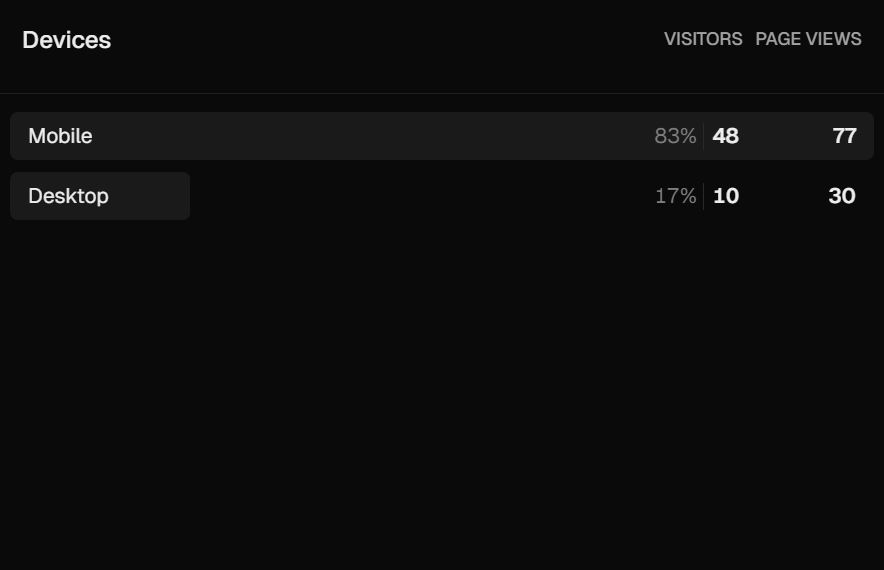
All forms of viewing
Post-launch analytics confirmed that a majority of visitors were on mobile devices, reinforcing the importance of an optimized experience on smaller screens.
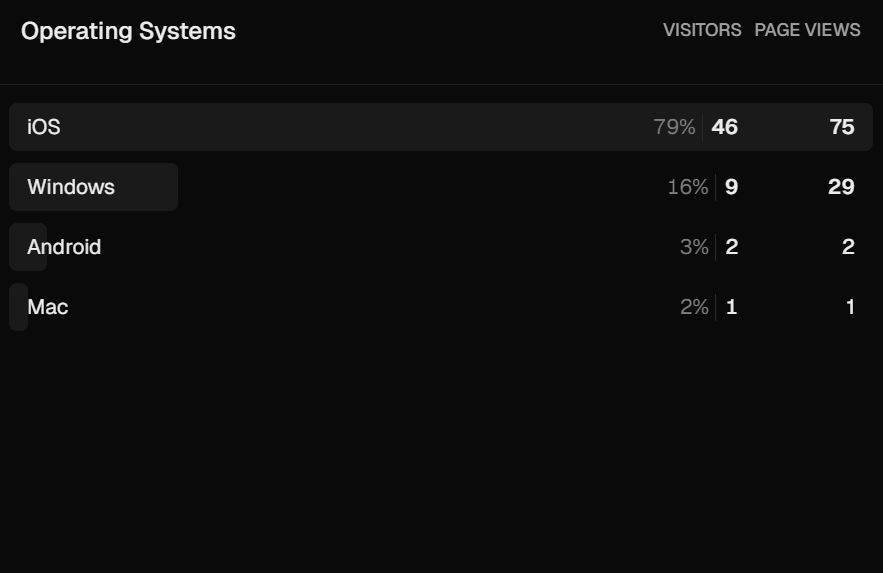
Operating systems
79% of viewers were on iOS devices.
Performance Optimization
When building F1Stats, I wanted not only a responsive user interface, but also a highly optimized backend to deliver data as quickly as possible. To achieve this, I implemented several performance improvements and measured their real-world impact through benchmarking tools.
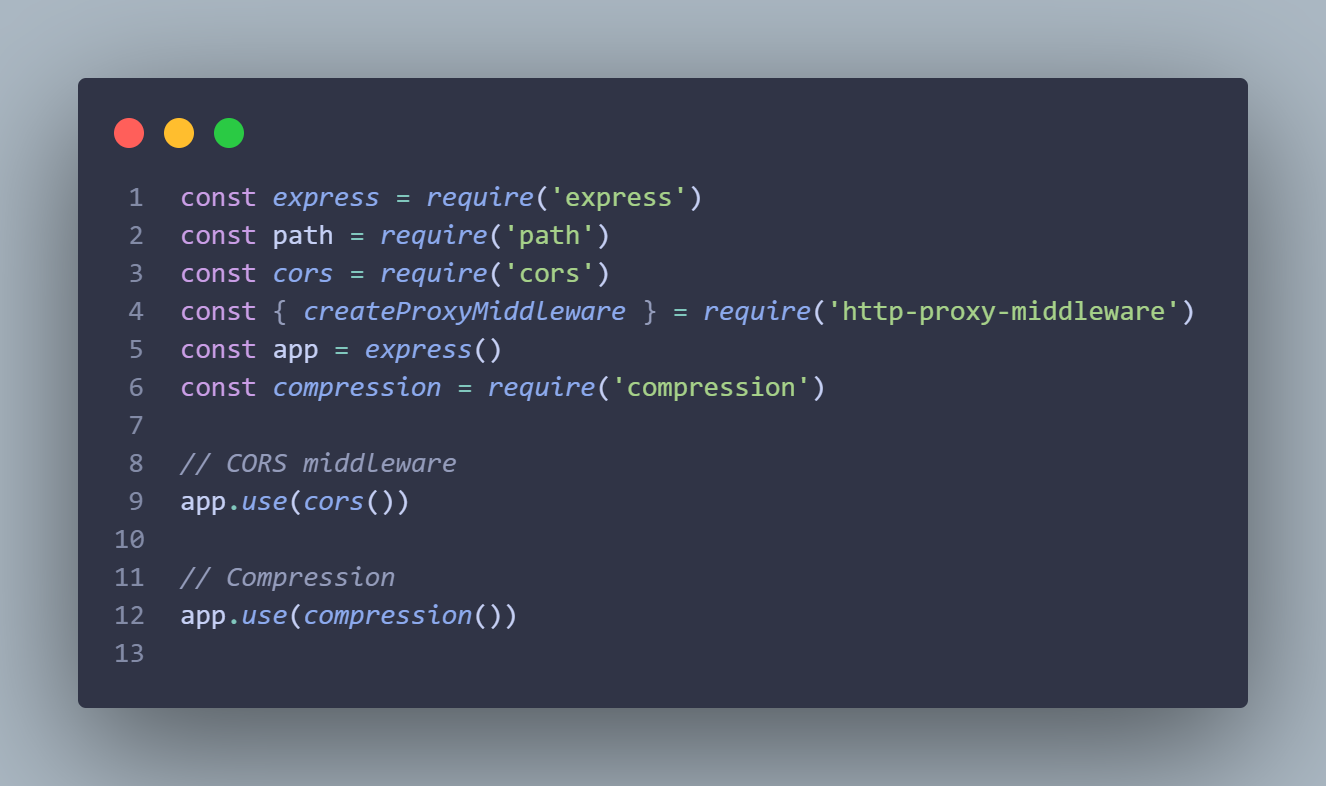
GZIP compression
To reduce server response size and accelerate delivery, I implemented GZIP compression to my files, which minimized bandwidth usage.
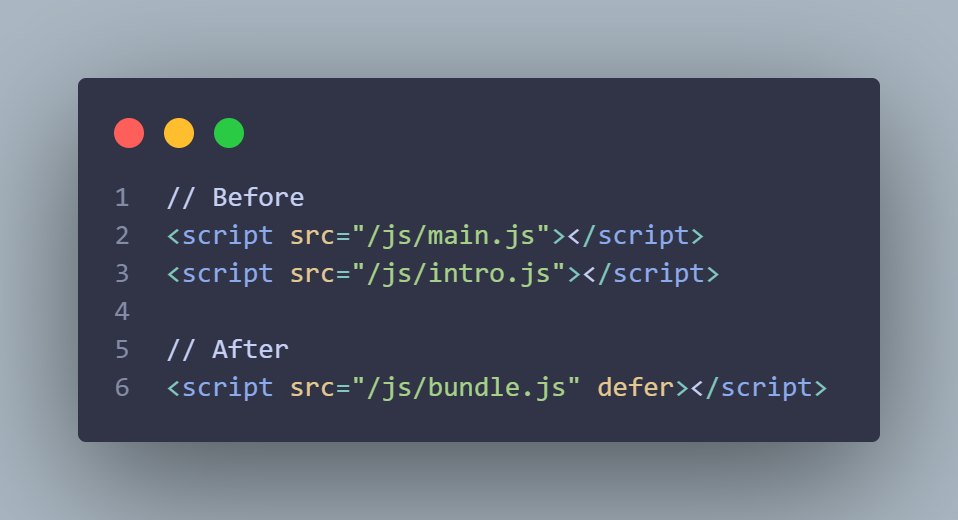
JS bundling & deferred loading
I bundled 2 JavaScript files using esbuild, reducing them into a single, minified file, cutting down the number of server requests. I also deferred non-critical JavaScript, which helped avoid blocking the initial browser paint and allowed the site to feel fast before all scripts finished loading.
Benchmarking Metrics
I used Lighthouse to benchmark performance. Even before optimization, my code was already well-structured, so the scores were already strong. Still, I fine-tuned what I could. After implementing GZIP compression, bundling JavaScript, and deferring non-essential scripts, I achieved ~0.9s for both FCP and Speed Index. The gains were minimal, but it was a satisfying confirmation that the foundation I built was already fast.
This project was an opportunity to combine my love for Formula 1 with my passion for coding. I learned how to fetch and process real-time data from an API and how to optimize my codebase for smaller screens. However, the most meaningful part for me was getting the chance to learn more about Formula 1's history. I also found one of my new favorite F1 cars...